lab
This procedure is part of a lab that teaches you how to instrument your application with OpenTelemetry.
Each procedure in the lab builds upon the last, so make sure you've completed the last procedure, Instrument your application with OpenTelemetry, before starting this one.
You've instrumented your database application with OpenTelemetry and you're sending trace data to New Relic.
Here, you move to New Relic to see the kinds of detailed telemetry data that you generated with just a few lines of OpenTelemetry code.
View your data
Log into New Relic.
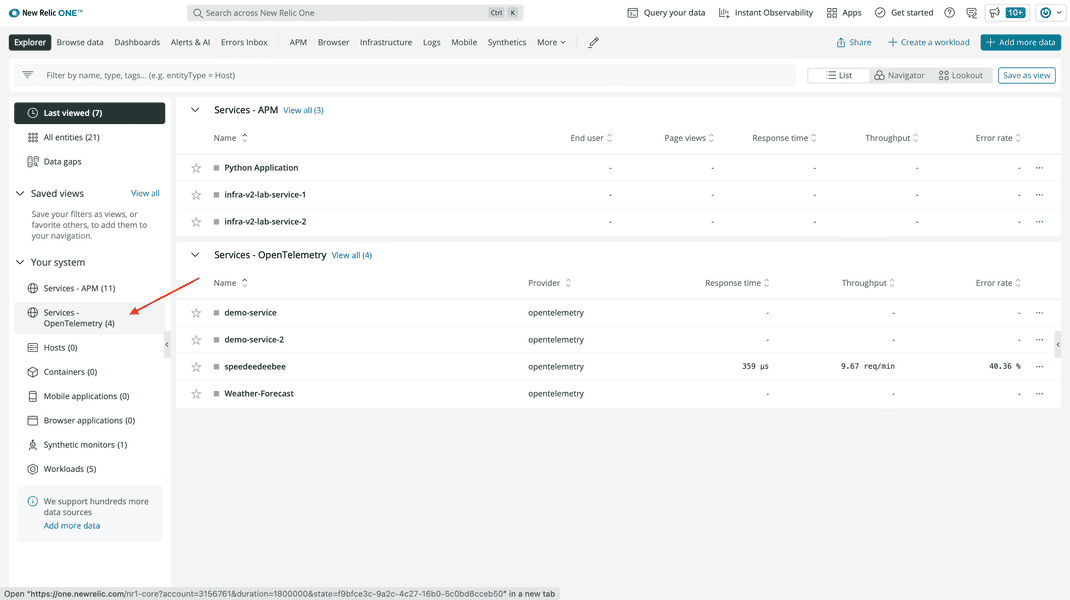
In the left-hand navigation, click Services - OpenTelemetry:
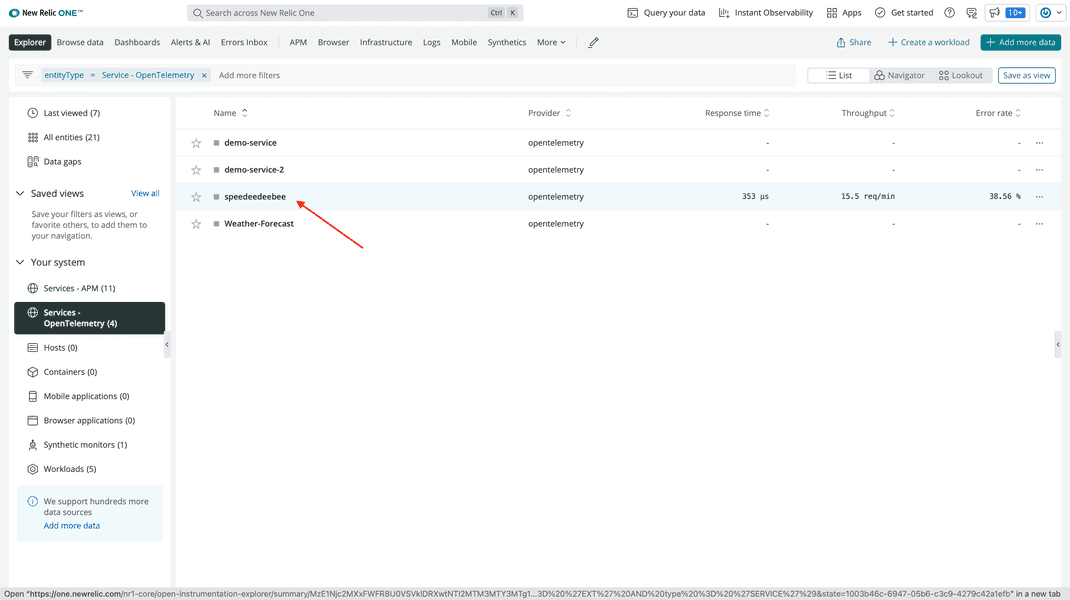
Click your service:
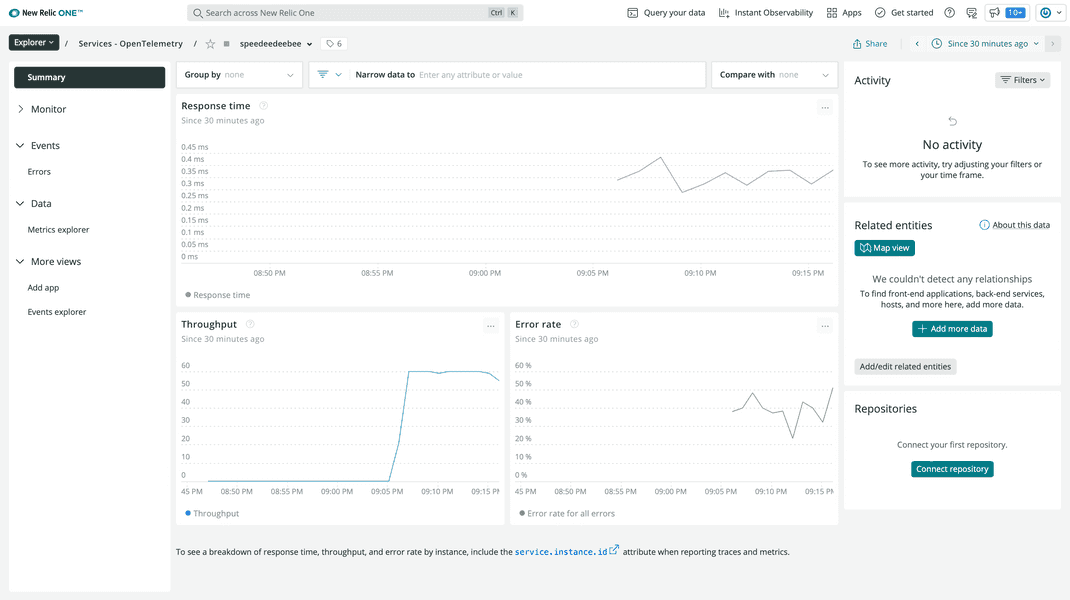
This brings you to a service view that shows trace data from your application, including:
- Response time
- Throughput
- Error rate
Tip
It can take some time for your OpenTelemetry data to get to New Relic. If you don't see your service yet, wait a few more minutes. If you still don't see data, compare your code to ours.
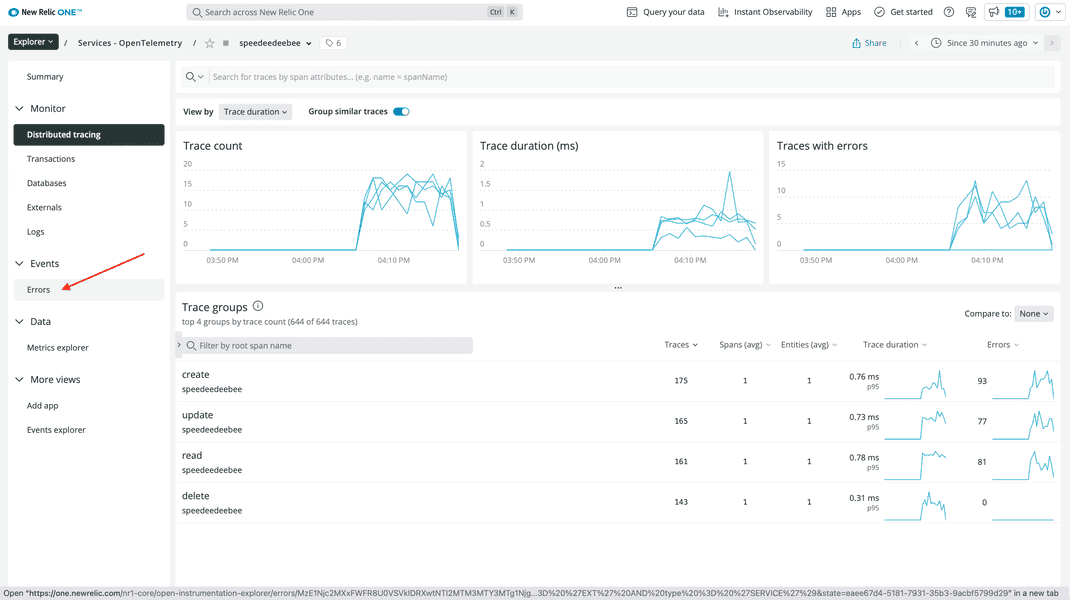
In the left-hand navigation, click Distributed tracing:
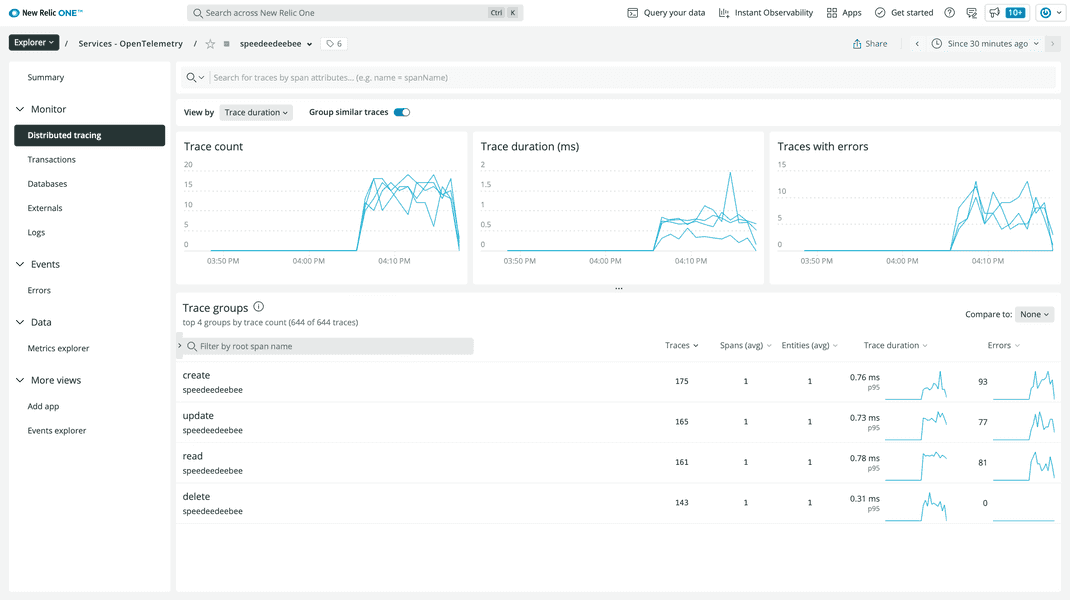
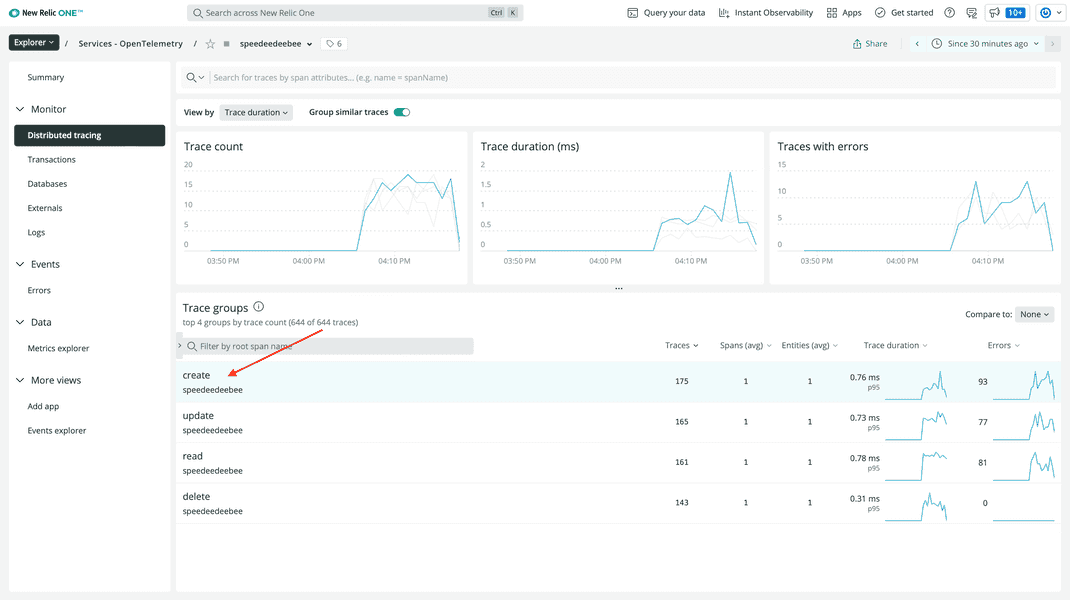
This shows data about the traces that you generated in your service:
- Trace count
- Trace duration
- Traces with errors
- Trace groups
Trace groups shows shows traces grouped by the name of their root span. Because all of your spans are root spans, there are four trace groups, one for each database function.
Click the create group:
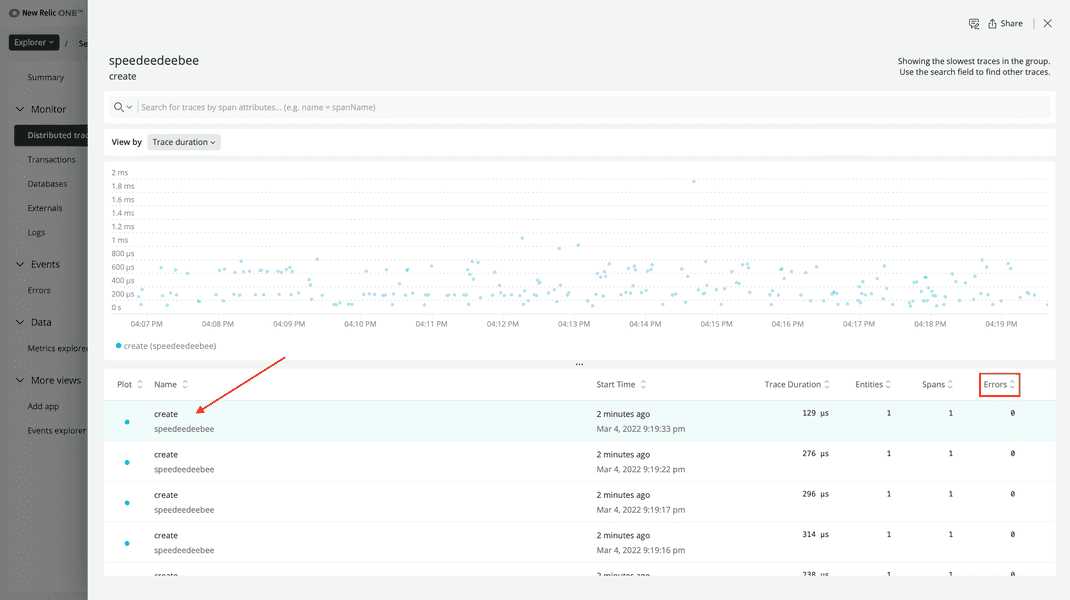
Order the traces by number of errors ascending, and click one of the traces with no errors:
Click on the span:
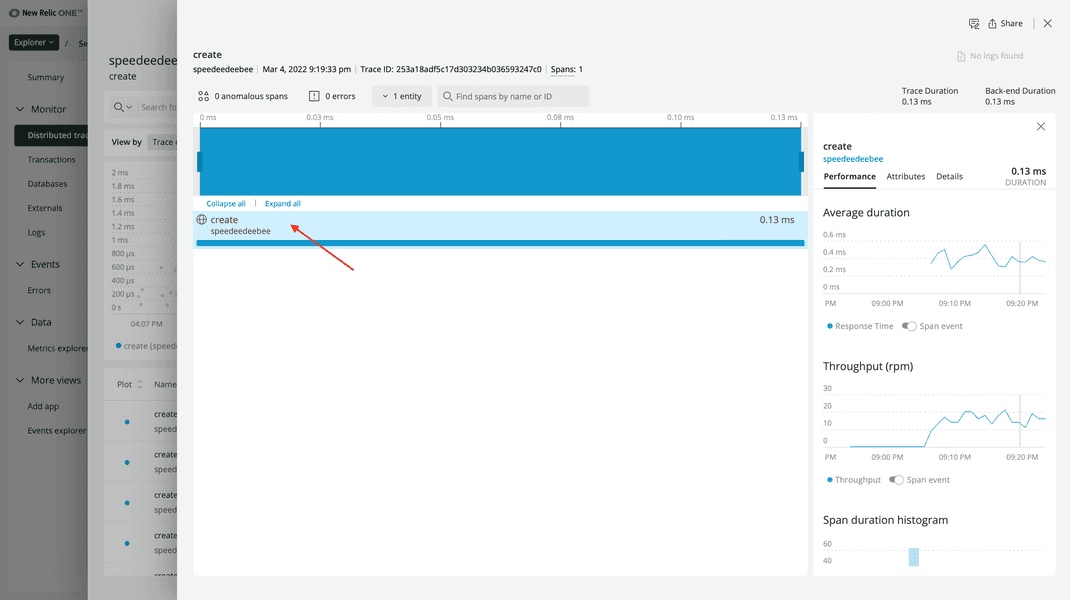
Here, you see performance data about the span, such as average duration and throughput.
Click Attributes:
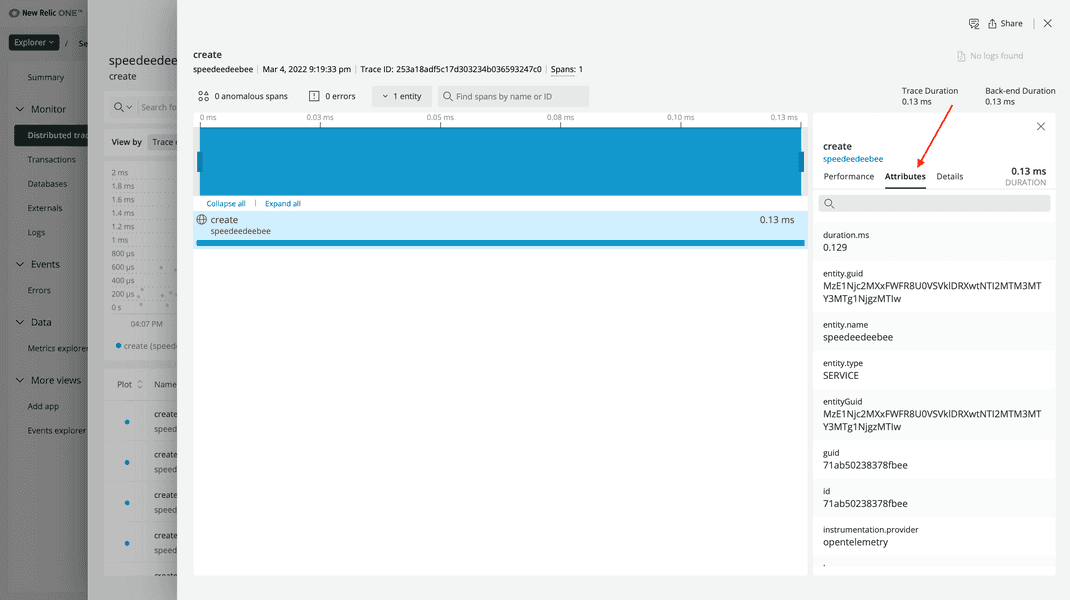
You configured a few of the attributes you see here in your SDK code. For example, the key that the simulator created:
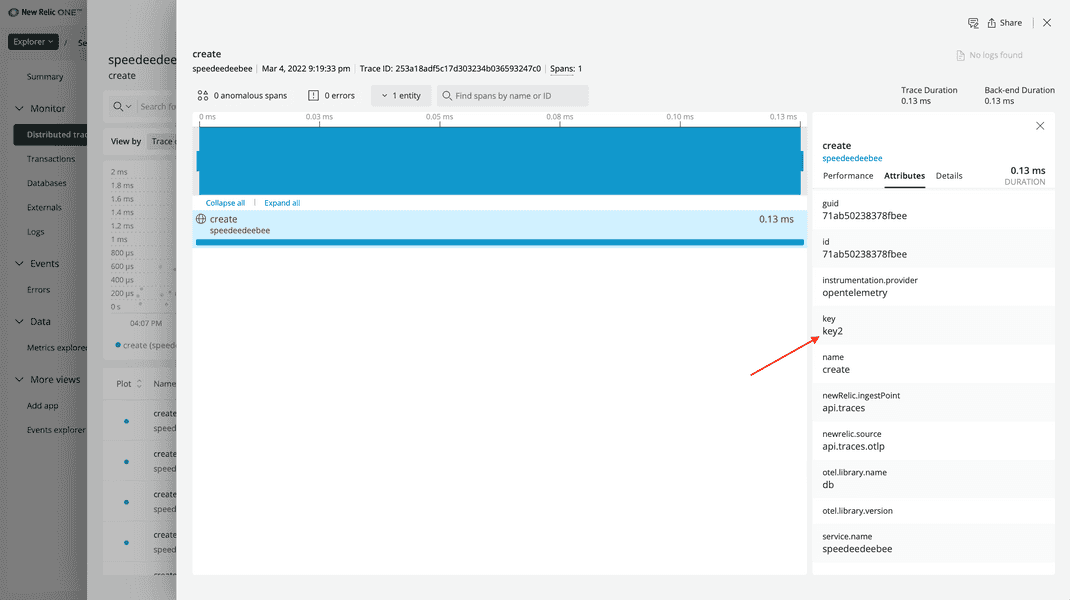
Now that you've seen the details that you captured in successful operations within your app, take a look at some of those errors.
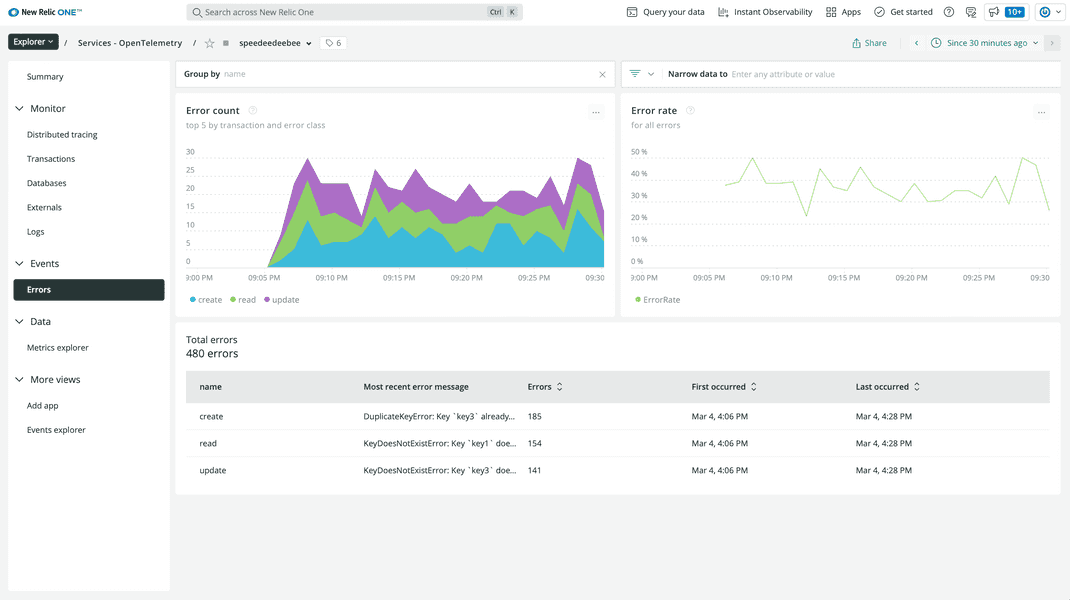
Back out of this view and click on Events > Errors:
Here, you see information about those span events:
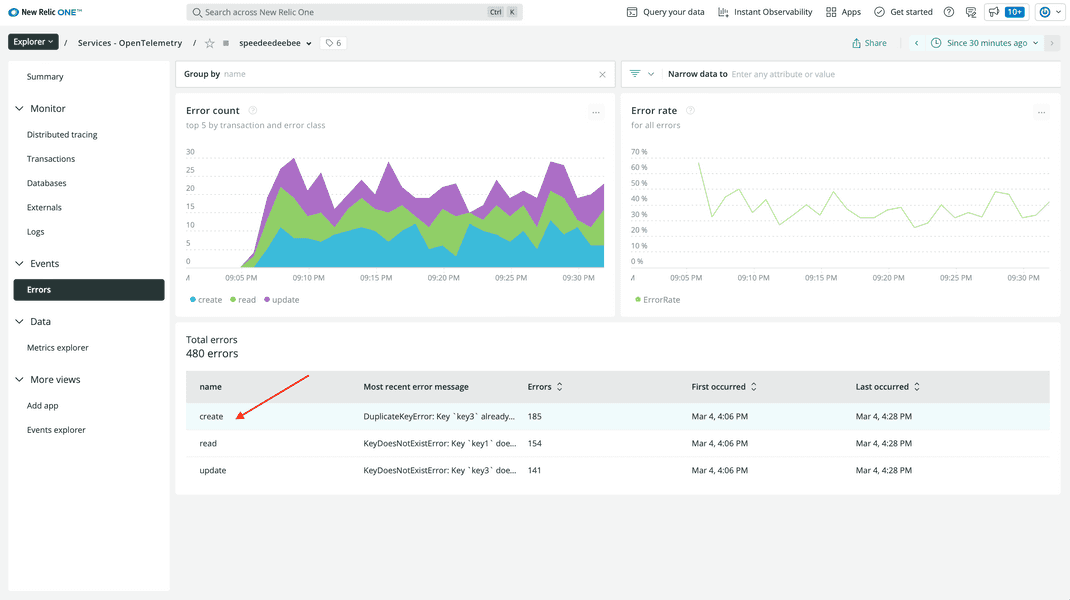
Click a create error:
Click a trace:
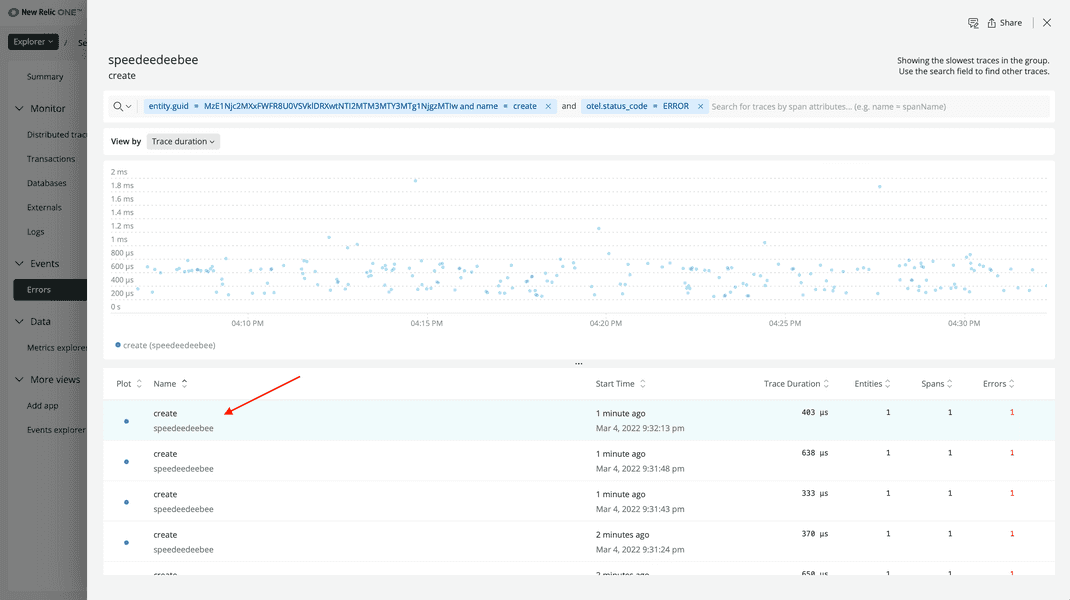
Click the span:
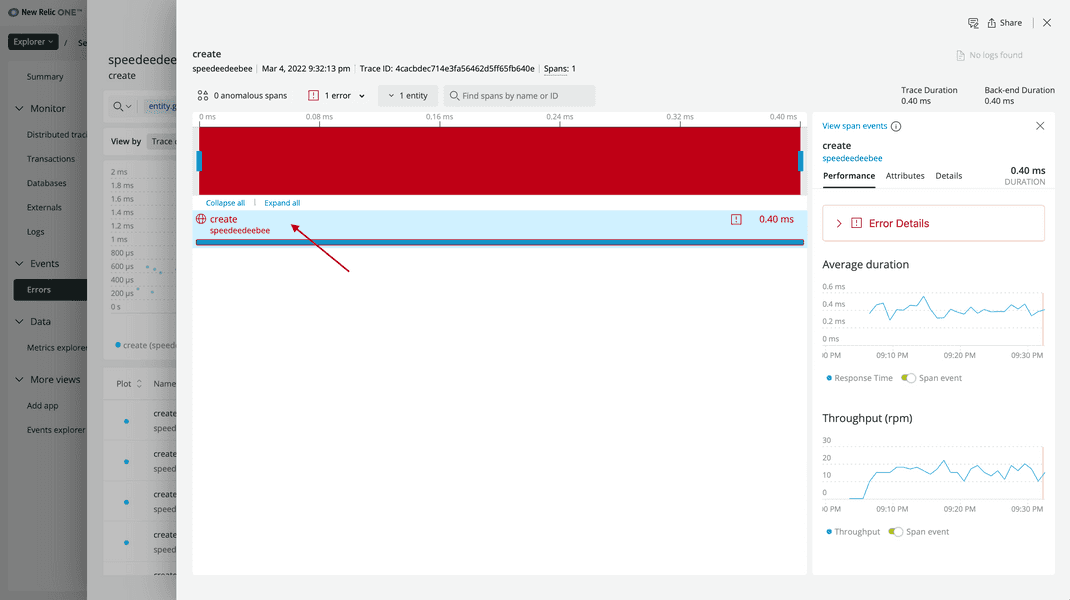
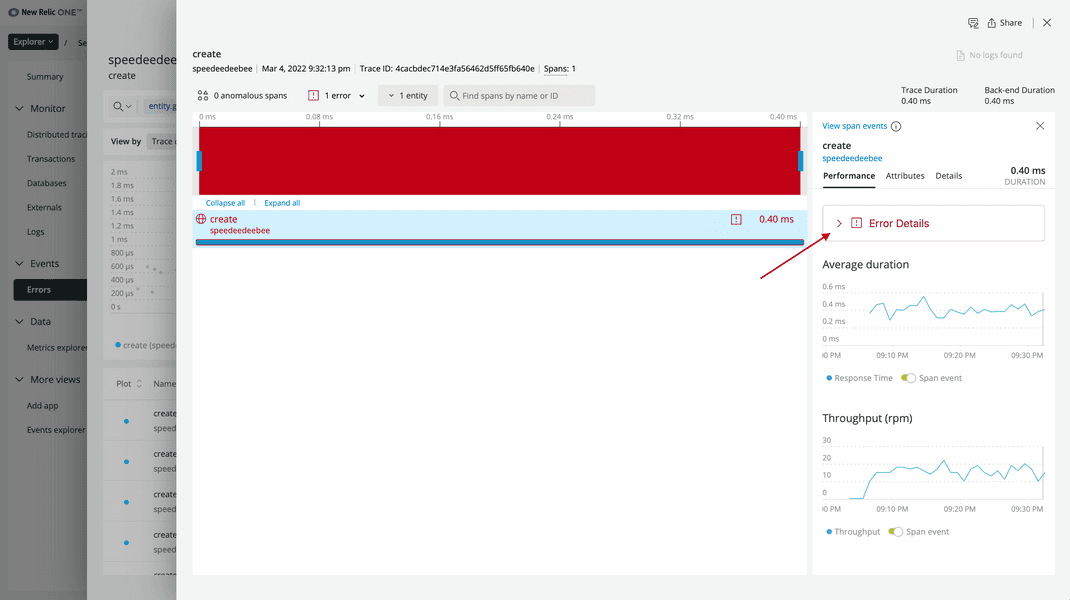
Here, you see a lot of the same information you saw in the span details, but there's also a new Error Details button.
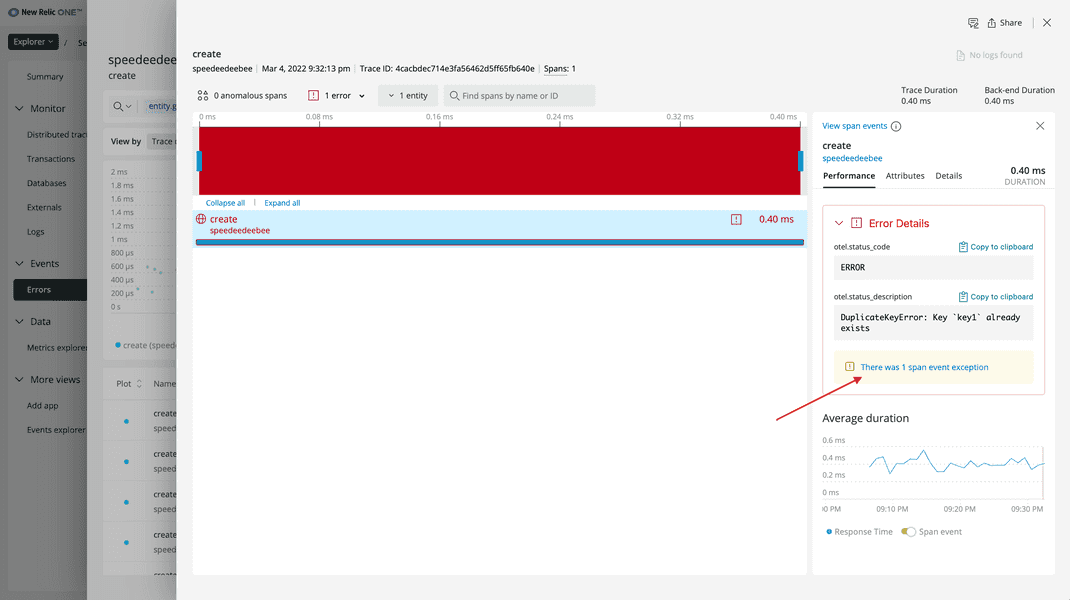
Click Error Details:
Here, you see the details of the exception span event:
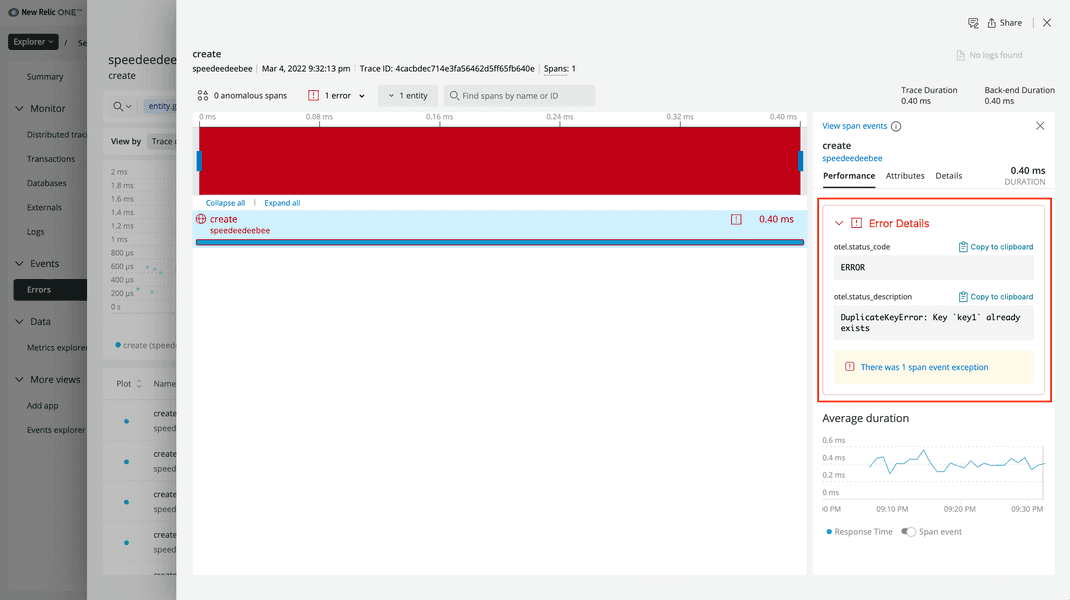
These details include the exception's status code and status description. With this, you know that your users are frequently making create() calls for keys that already exist in the database.
This is great information, but you can see more, including the stack trace of the exception, to further assess the errors.
Click There was 1 span event exception to see further details about your exception:
Here, you see more details about your exception, including its stack trace, type, and timestamp:
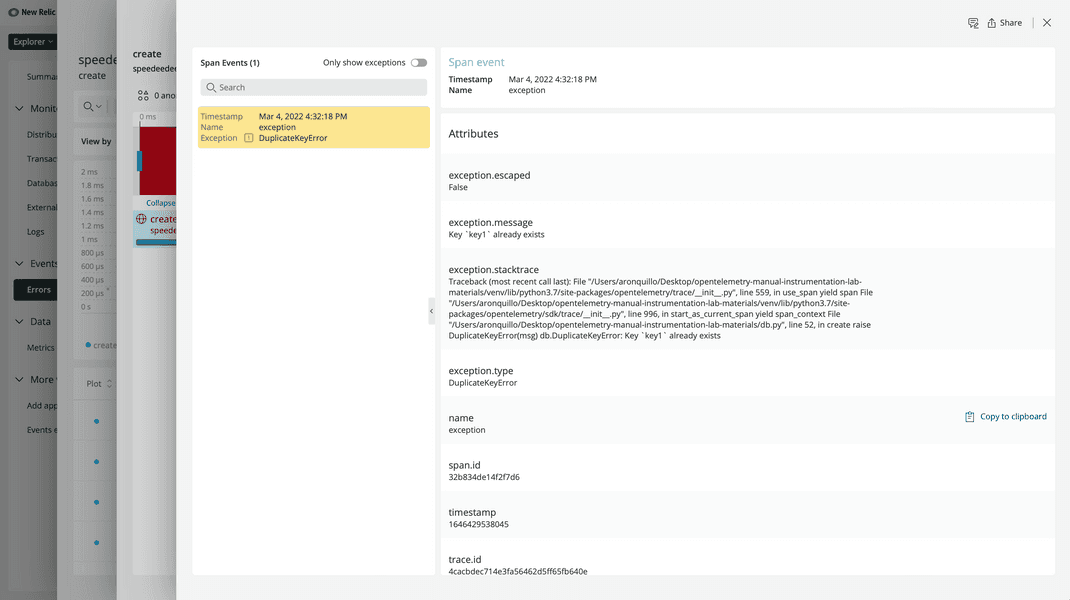
After reviewing this information, you decide that this isn't an error at all, it's a feature. You designed your database to only allow creates on new keys, which is logical. This shouldn't be captured as an error in your code. Doing so could make real errors harder to see.
The reason this is captured as an exception span event in your application is because the context manager that you used automatically records data about uncaught exceptions as span events. To prevent this from happening, while still providing yourself the option of seeing these events, you need to update your code to store a custom span event.
lab
This procedure is part of a lab that teaches you how to instrument your application with OpenTelemetry. Now that you've viewd your data in New Relic, adjust your instrumentation to record a custom span event.